Few years ago, I had to work on deploying a RADIUS architecture based on freeradius. Working on this very interesting project, made me contribute my first patches, together with some Cacti templates. Those templates are apparently used by some folks around as I receive, every now and then, questions on how to install or “WTF is this error? And so on and so forth. So, in order to make it easier to use (although it’s not exactly what one would call a headache), Here is a little guide for configuration.
This is honestly no different from installing any cacti plugin…
The topic of this article being the freeradius2 plugin and not Cacti installation, I will assume you have a working spiky monitoring tool.
Archive download.
You can first download the archive here. In it you’ll find:
radstatus.sh: the bash script used to extract data.cacti_host_template_freeradius_server.xml: the host templatecomponents: A folder containing each template of each component. This is only useful if you plan not to use a some templates and don’t want to install them.cacti_data_template_freeradius_acct_status.xml: data template for accounting statistics.cacti_data_template_freeradius_auth_status.xml: data template for authentication statistics.cacti_graph_template_freeradius_acct.xml: graph template to render accounting data.cacti_graph_template_freeradius_auth.xml: graph template to render authentication data.
Dependancies
As Freeradius 2 doesn’t provide any SNMP interface anymore, none of those templates depends on another SNMP templates (nor any other).
On the other end, the bash script uses the radclient binary file. On Debian based distros, you would require the freeradius-utils package. Apart from that, you’ll need sed, but I bet you have it installed somewhere already.
Preparing the radius server
Since freeradius 2.0, server statistics are available using specific radius queries called “status”. In order to allow Cacti to send such queries to the RADIUS server, the later have to be setup to listen for status queries and define the monitoring server as a client.
If you’re using Debian, there is even a file you can use as a template: /etc/freeradius/sites-available/status. just edit it and link it to /etc/freeradius/sites-enabled/. In this file, make sure the server listens on an interface Cacti can reach, and define it as a client.Eventually, your file should look like what’s bellow:
server status {

listen {

type = status

ipaddr = 0.0.0.0

port = 18121

}

client admin {

ipaddr = 2.3.4.5

secret = changeme

require-message-authenticator = no

}

authorize {

ok

Autz-Type Status-Server {

ok

}

}

}
Installation
the script
The file radstatus.sh must be copied on the Cacti server, in the directory <path_cacti>/scripts (Debian packages installs cacti in /usr/share/cacti/site).
the templates
Template installation must be done in the admin console, so login to Cacti as admin.
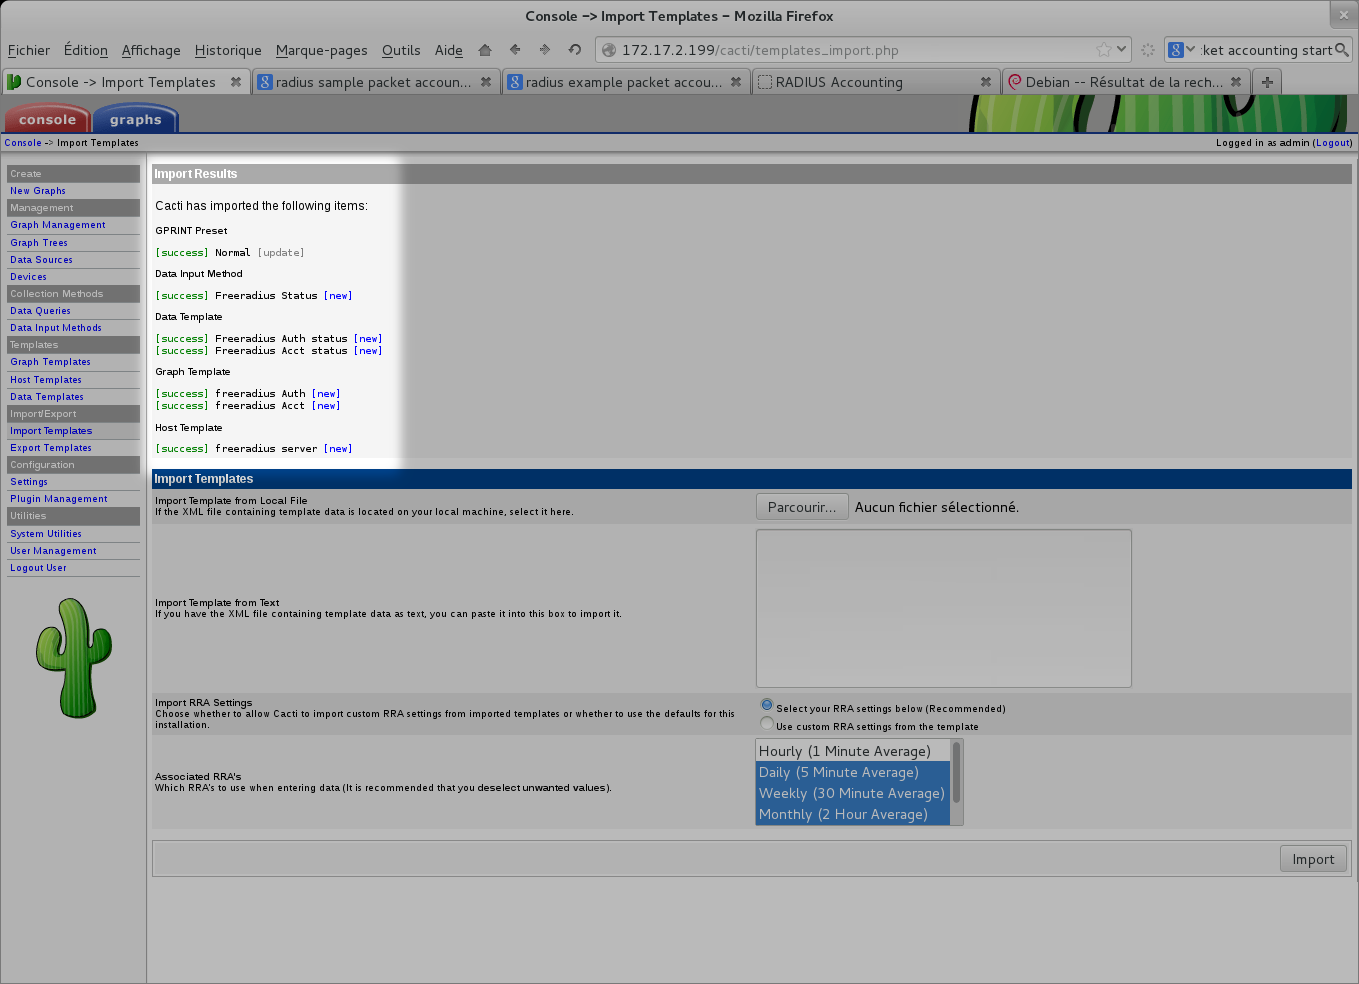
In the admin console, go to the “Import Templates” menu, and click “Browse” in the form to select the host template (cacti_host_template_freeradius_server.xml). Click “Import”, and if everything went OK you should witness the screen bellow:
Configuration
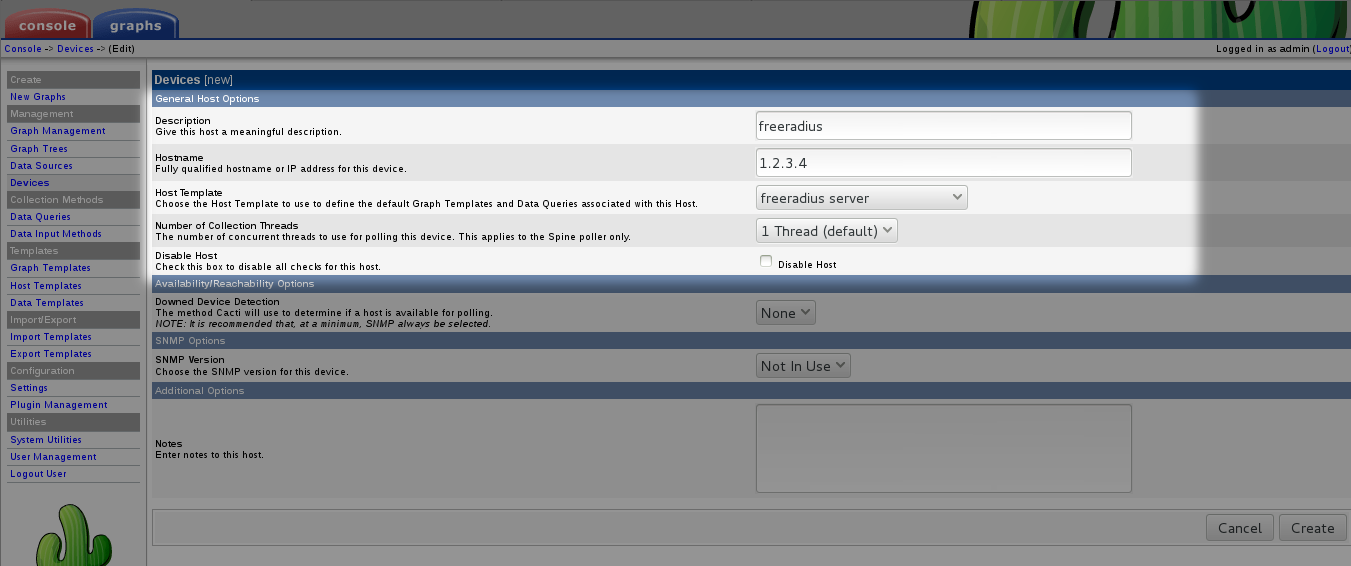
You can now create a new host using the “freeradius server” template. From the “Devices” menu, click on “Add”, and fill in the form as shown bellow (Here I have disabled host detection and SNMP for the sake of simplicity, but obviously you can use it safely):
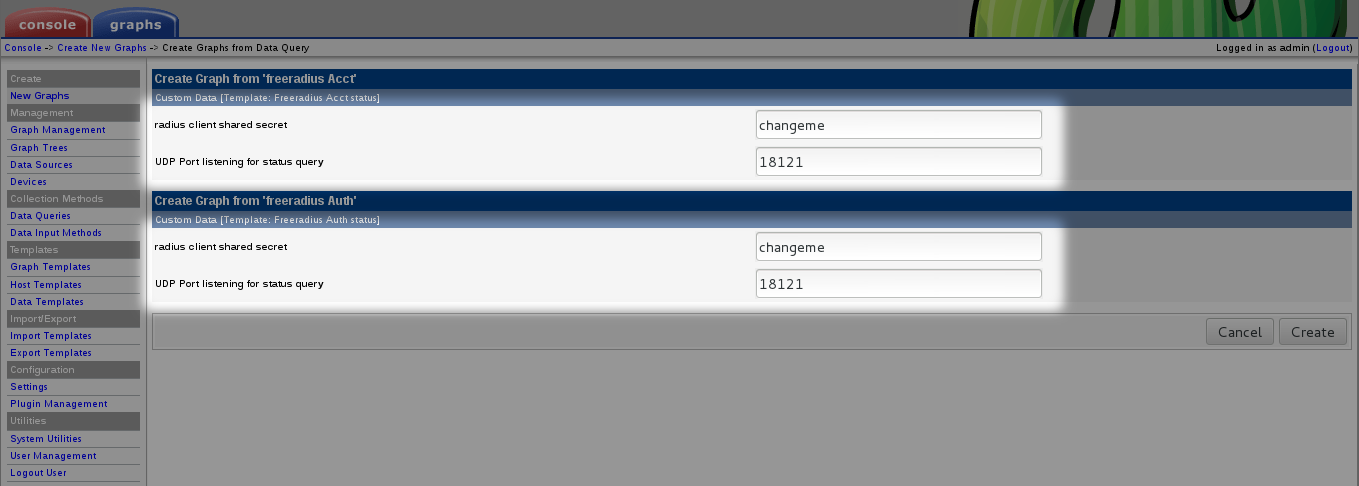
Finally, head to the freshly created host and in the upper right corner click on “Create Graphs for this Host”.
Tick every freeradius template and then click “Create”. Fill in the form with the values for “secret” and “port” we defined in the freeradius status server:
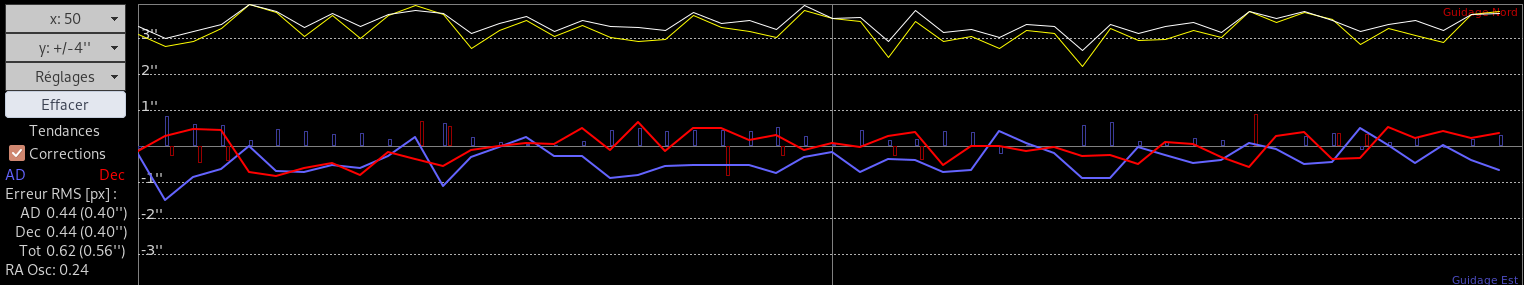
You’re done, just wait for graphs to be drawn.
Leave a Reply to Nadir Cancel reply